
Scope guide · Picture & exposure
Histogram
Read component populations and identify concentrations that deserve a closer look in Picture or Waveform.
ExpressProfessionalLearn & Reference / Scope library / Histogram
How much of the picture is clustered in shadows or highlights?
Add this view from Add scope > Histogram, then choose the input you want to inspect. Use the pane's i button for its in-app reading guide.
Read this example.
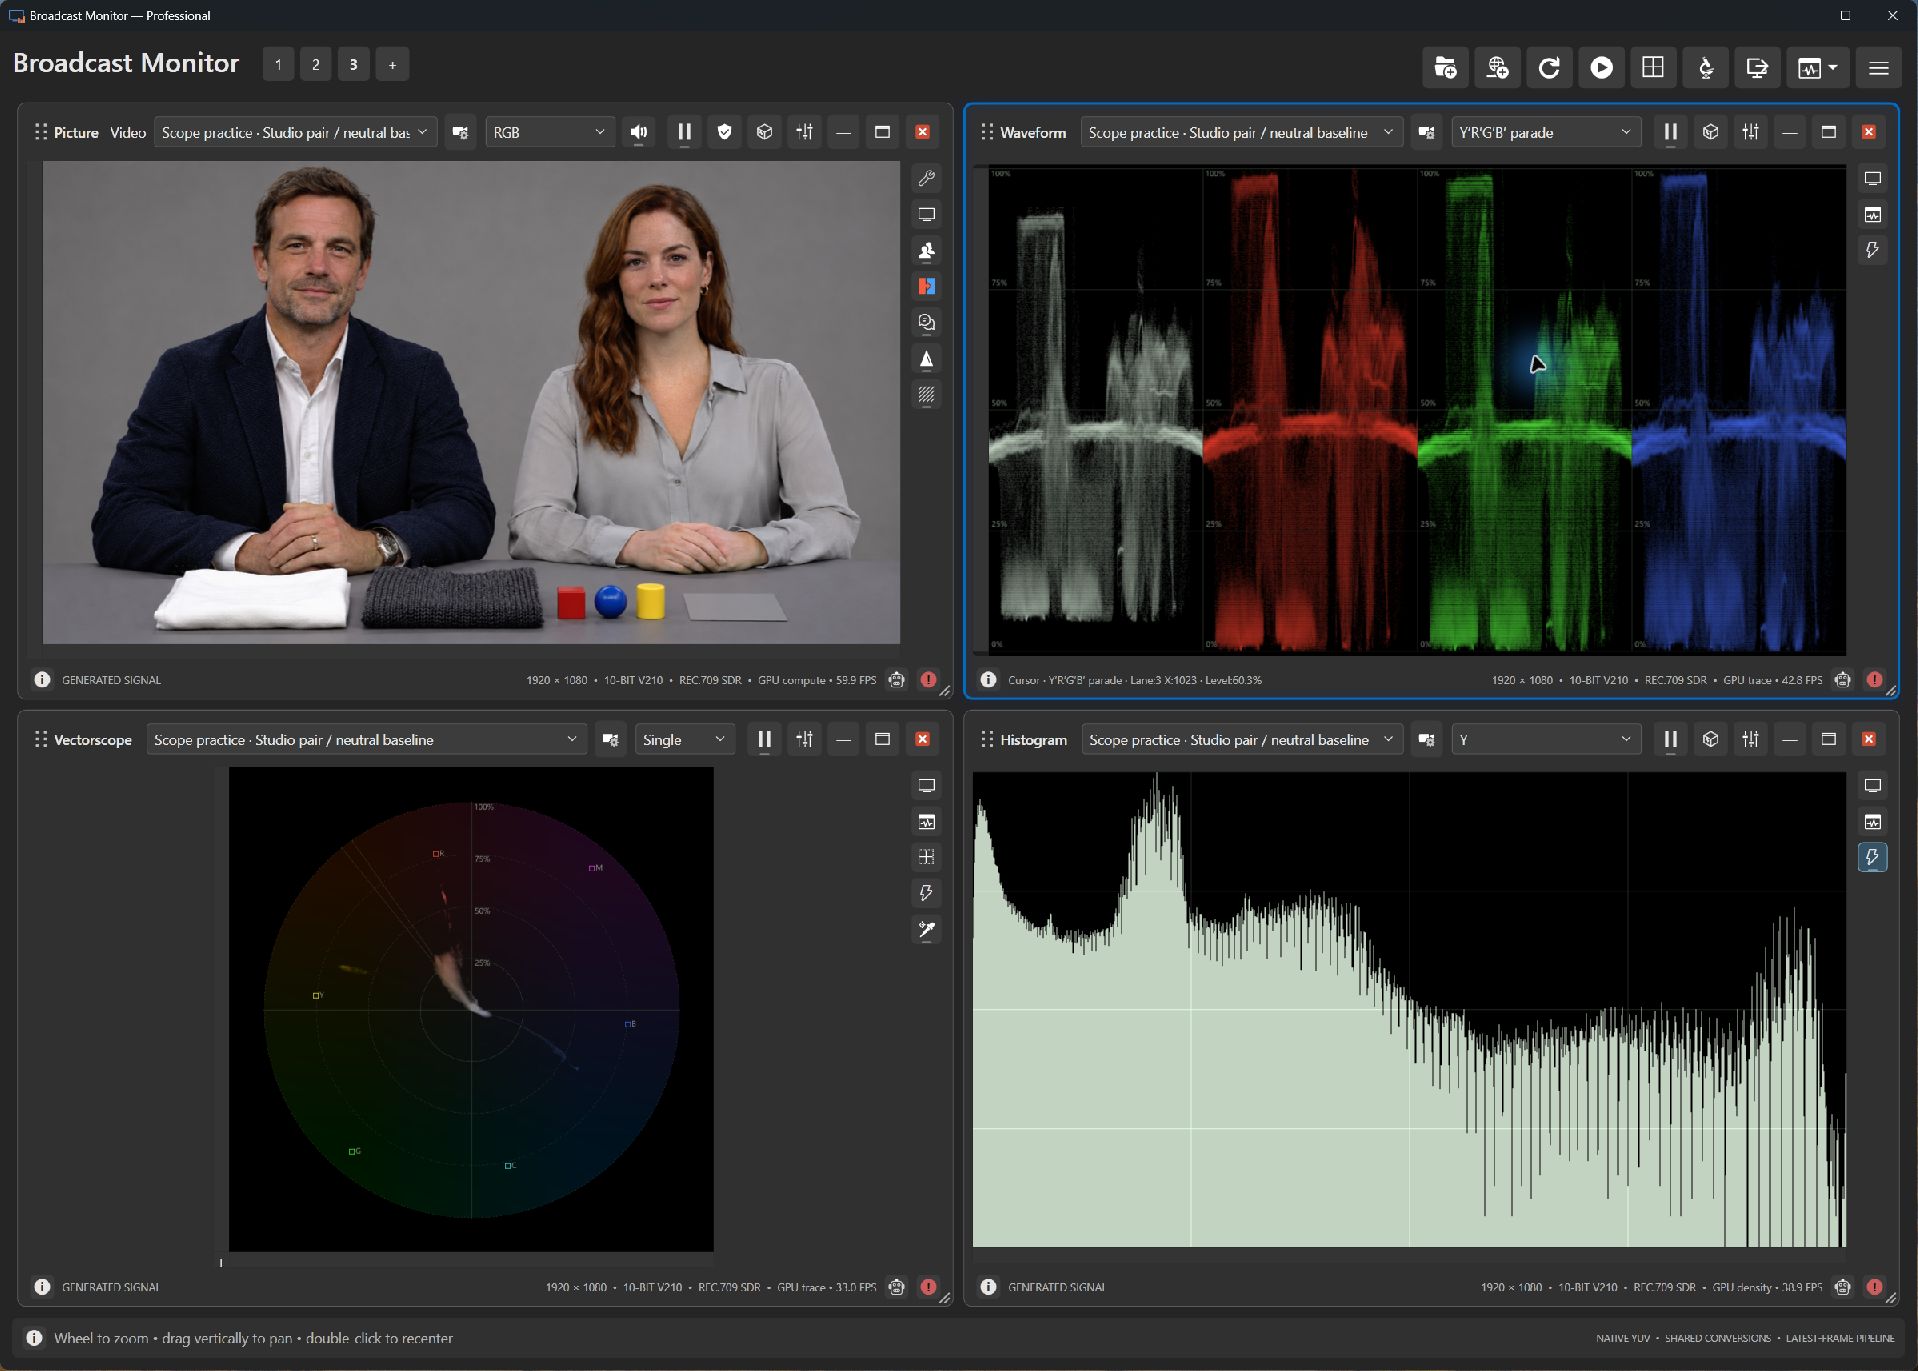
- The low-end population includes dark jacket and cloth pixels. The large middle concentration includes the gray background and table.
- A higher-level population at the right includes the white fabric. Faces and lighter clothing contribute other populations.
- The level axis locates a bin; population height describes how many samples fall into it.
Try it yourself.
- Choose Studio pair / neutral baseline in Picture and Histogram. Compare Y and Y′.
- Try vertical and horizontal bars, following the level-axis labels.
- Choose a parade to compare component populations; Professional adds individual components and combined HSV.
Useful controls.
- Orientation controls bar direction; Layout controls component panels.
- Count scale changes population presentation between linear and logarithmic.
- Color background adds a dim signal-level reference behind measured populations.
Use Waveform to locate a population spatially. Histogram describes the distribution of the samples included in analysis.